Console JS – Javascript debug
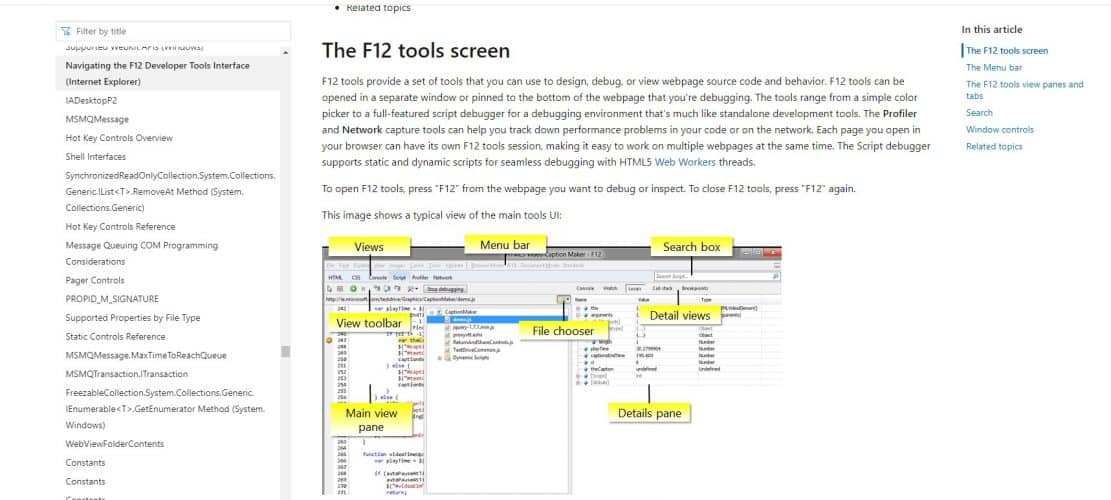
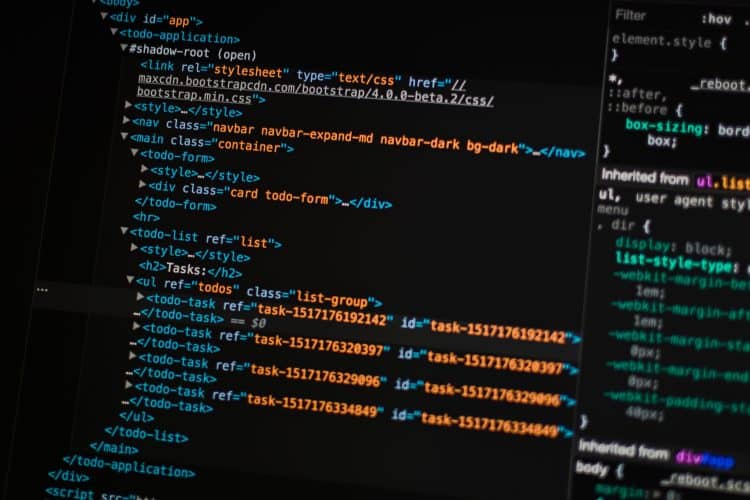
Almost all modern browsers have built-in development tools that are compatible with JavaScript and other popular web technologies. Among these tools is the Console that has an interface similar to that of a shell. It comprises the ability to inspect the DOM, analyze the network activity and, debug any error with the debugger. The console allows to log information during the JavaScript development. It also allows the user to interact with the webpage. On the console, the user can write, monitor, and oversee the JavaScript. In this article, we explain the working of the Console in JavaScript within the browser’s context. How to use the console in different Browsers? Almost all the group of modern web browsers that provide support for HTML type and XHTML type, provide their users with access to a developer console by default that can be used to work with JavaScript in an interface that is…


