Debugbar – News on Digital Marketing and Technologies
Web Development
Digital Marketing
Social Media
Sorry, no posts were found.
SEO
Debugbar is an IE (Internet Explorer) web development bar, divided in a toolbar and a sidebar. It aims to help you debugging your website faster or to analyse quickly any web page.
The Toolbar

The toolbar is a the top of the IE browser. This bar contains several features to ease your debug session:
- Customize the DebugBar
- Check for updates
- Alert on javascript errors
- A must one: send page screenshot by email
- A smart color picker
- Zoom page
- View source code
- and more
The sidebar

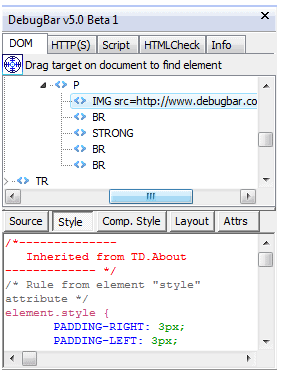
The sidebar is divided in 5 tabs allowing to debug each specific categories like:
- The DOM Tab: this tab allows to explore the DOM tree code of the generated web page and modify the tag and the CSS attributes
- the HTTP tab: to check the HTTP/S request , the GET and POST parameters and the AJAX requests
- Script Tab: easier for debugging javascript and AJAX requests
- HTML Check tab: allows to validate and optimize the HTML code of the web page
- Info page: miscelleanous informations of the page
How to install Debugbar ?
- Download Debugbar
- After having downloaded the Debugbar, just click on the file and follow the instructions. The 2 bars will be installed easily and quickly
- They should automatically been displayed the next time you open Internet Explorer. You can also go to the menu Toolbars and check “Debugbar”.
Debugbar also provides regular content about web development and digital marketing.


